Operating History and Pro Forma Statement
Some financial issues can be better identified and addressed by performing a line item analysis of a property’s recent operating statements. A review of historical financial data will reveal trends in specific income and expense categories. These can lead to many conclusions, such as problems from deferred maintenance, excesses in expenses, or missed opportunities in income generation—all of which impact net operating income (NOI).
In addition, you can compare individual line items in the subject property’s operating history to industry standards. Through this comparison, you may conclude that the property’s performance can be enhanced in one or more areas. Or it may be apparent that the property is functioning optimally for its location, type, and condition. All of these observations will provide a basis for projecting future years’ income and expenses over the anticipated holding period.

Check out this video
Ken Goodacre CPM®
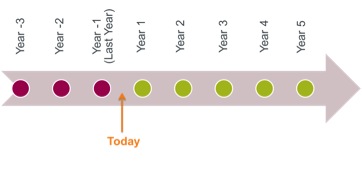
Anytime we analyze a real estate asset for investment purposes, we need to draw out a timeline or sometimes we might use a t-bar, in order to develop what the future cash flows would be for this particular property for the period of time that we’re analyzing. So I like using the t-bar to calculate the numbers, calculate the value, but the timeline to show where the property sits at any one point in time.
So I’m standing right now on the operating history of the property, developed in the past. Because the first line is today. Where we are today. The value of future income that we forecast, valued back to today, to develop the present value for today. And then, after the cash flows, we have the future value of the property, you may hear it called “terminal value,” “net sales proceeds,” “reversion.” Whatever the term may be that signifies the final event, or on our timeline we called it the “future value.” All of these cash flows, including that reversion, are discounted back to the present, to give us the present value of the property. Remembering that we draw information and forecasting for the history of the property, but that is not included in the timeline.
The pro forma statement of cash flow is an annual statement that lists income and expenses for the property. It includes all revenue and operating expenses through net operating income (NOI) and before-tax cash flow (BTCF).
Managers with experience planning for different owners and property types know that there are unique requirements for handling fiscal considerations such as replacement reserves or capital expenditures in each situation. Because of this, managers create multiple versions of these statements according to the needs of property ownership. Below is the standard IREM® pro forma statement.

The GPI for the property in its as-is state should be determined by using the market rental rates provided.
Loss to lease is the difference between market rents and the rent the property is actually charging. When rents are below market, there is a loss that must be accounted for.
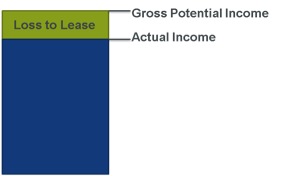
For example, if a one-bedroom, one-bath apartment in a 40-unit building is currently renting for $775 per unit, but market rents indicate that it should be renting for $825 per unit, there is an annual loss to lease of $24,000.
$825 – $775 = $50 x 12 months = $600 x 40 units = $24,000
Because the as-is scenario means no capital improvements or operational changes, including staffing, increase or decrease as-is Year 1 income and expenses by no more than 5% for trending or inflation only.
|
Item |
Description |
|
Gross Potential Income (GPI) |
|
|
Loss to Lease |
|
|
Vacancy and Collection Loss |
|
|
Net Rent Revenue |
|
|
Miscellaneous Income |
|
|
Expense Reimbursements |
|
|
Effective Gross Income (EGI) |
|
|
Operating Expenses |
|
|
Net Operating Income (NOI) |
|
|
Annual Debt Service (ADS) |
|
|
Before-Tax Cash Flow (BTCF) |
|
| FINAL PROJECT NOTE |
|---|
|
Your subject property case study will include 3 years of operating history, which you will analyze. A suggested market rental rate, based on comparables, will also be provided. You should use the IREM Financial Analysis Spreadsheet to forecast and discuss Year 1 in the as-is pro forma statement for all income and the three largest expense categories. Finally, you will project income and expenses over the holding period and justify the escalation percentages you chose. |
Current Market Value and Current Equity
Back to TopThe income capitalizationapproach, or IRV formula, estimates the current market value of a property by applying a capitalization rate to the annual net operating income (NOI) that the property is expected to produce. Following is the formula.
Income (I) ÷ Rate (R) = Value (V)
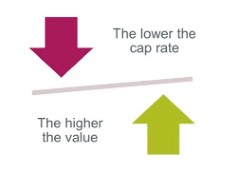 Since capitalization rates reflect the nature of risk taken with a real estate investment, there is an inverse relationship between capitalization rates and value. The higher the capitalization rate, the lower the value of the property. The lower the capitalization rate, the higher the value of the property.
Going-In and Going-Out Capitalization Rates
Back to TopNote that in any test for value over time, the real estate manager is required to make assumptions about the cap rate at the starting point of the test (the going-in cap rate), and at the terminal point of the test (the going-out cap rate).
Capitalization rates are influenced by changes in market conditions and economic cycles of recession, depression, recovery, and prosperity. Accurately projecting going-out cap rates is difficult because it is a long-term forecast. Going-out cap rates may be lower, equal to, or higher than going-in cap rates. The going-out cap rate is generally, though not necessarily, higher than the going in-cap rate because there is a greater risk in estimating the income at the end of the holding period, and the remaining economic life of the property will be reduced unless capital improvements are made.
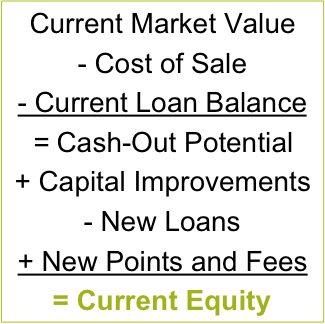
Once the current market value is known, the owner’s current equity can be determined. Midstream analysis is used to determine current equity as follows.
| FINAL PROJECT NOTE |
|---|
|
Your subject property case study will include information about the initial purchase price, cost of sale, loan terms, and recent sales in the area. You will state and justify the going-in and going-out capitalization rates you used. You will determine and discuss the current market value of the property and current ownership equity. |
Loan Analysis
Back to TopA thorough financial analysis will include a discussion of the property’s loan terms as well as results of loan analysis tests and measures of leverage.
Lender Ratios
Two of the most common loan analysis tests are
- Loan-to-Value Ratio (LTV%) and
- Debt Coverage Ratio (DCR).
A borrower must meet the lender’s criteria in both of these areas in order to qualify for the loan.
Loan-to-Value Ratio (LTV%)
Loan-to-value ratio (LTV%) is a lender’s test to ensure that the loaned funds are secured by the value of the real estate. It compares the amount of the loan principal to the market value of the property.
Loan Amount ÷ Value = LTV%
The lower the LTV%, the lower the risk is to the lender. This ratio attempts to ensure that if market values decline and default or foreclosure is necessary, the property will be worth more than the balance due on the loan.
Debt Coverage Ratio (DCR)
The debt coverage ratio (DCR) compares the annual net operating income (NOI) to the annual debt service (ADS) of the loan. This ratio expresses the ability of the property to pay back the loan.
NOI ÷ ADS = DCR
NOI reflects income minus operating expenses. ADS includes the loan principal and interest. Thus NOI should be greater than ADS, resulting in a ratio greater than 1. The closer the DCR is to 1, the riskier the loan. Likewise, the greater the DCR is, the safer the loan is for the lender.
|
LTV% AND DCR EXAMPLE |
|---|
|
Suppose a property you manage has a loan in the amount of $550,000 and is valued at $750,000. What is the loan-to-value ratio (LTV%)? $550,000 ÷ $750,000 = 73% What if the same property had a loan in the amount of $650,000? Now what is the LTV%?$650,000 ÷ $750,000 = 86% The lower loan amount, and thus the lower LTV%, is less risky for the lender. Suppose another property you manage has a net operating income (NOI) of $150,000 and an annual debt service (ADS) of $125,000. What is the debt coverage ratio (DCR)?$150,000 ÷ $125,000 = 1.2 What if the same property had an NOI of $200,000? What is the debt coverage ratio (DCR)?$200,000 ÷ $125,000 = 1.6 This means that for every dollar in debt the property carries, it has 1.2 or 1.6 dollars of income, respectively, to cover that debt. Thus, the higher DCR is less risky. |
Measures of Leverage
Back to TopFinancing allows an investor the opportunity to use borrowed funds to acquire investment real estate. When the rate of return on an investment is increased with the use of debt, the financing offers a positive leverageposition. Conversely, when the rate of return on an investment is decreased with the use of debt, the investment is in a negative leverage position. Leverage position is not static—it can change over time from positive to negative or negative to positive.
The leverage position can be determined by comparing three critical measures.
- Free-and-Clear Rate of Return
- Loan Constant (k%)
- Cash-on-Cash Rate of Return ($/$%)
Free-and-Clear Rate of Return
The free-and-clear rate of return measures the return potential of a property that is free of debt. This ratio compares net operating income (NOI) with the total property value.
NOI ÷ Value = Free-and-Clear Rate of Return
Loan Constant (k%)
The loan constant (k%) represents the current amount paid for each dollar of borrowed funds. It is the percentage of a loan balance that is required annually to service principal and interest payments on the loan.
The term constant refers to a constant method of calculation rather than a constant value. Because the loan constant includes both principal and interest payments, it is always higher than the loan’s interest rate, except in interest-only loans, wherein the loan constant equals the interest rate.
ADS ÷ Loan Amount = k%
Loan constants are used to assess the cost of borrowed funds. When shopping for a loan, the investor usually looks for the loan with the lowest constant since it will produce the lowest annual debt service and, consequently, the highest cash flow.
Cash-on-Cash Rate of Return ($/$%)
The cash-on-cash rate of return ($/$%) measures an investor’s rate of return on the capital invested. This ratio compares the equity invested (or current investment) with the before-tax cash flow (BTCF) for one year. It is most commonly used to show year-to-year trends in performance.
BTCF ÷ Current Equity = Cash-on-Cash Rate of Return ($/$%)
AnalyzingLeverage Position
Comparing the free-and-clear rate of return with the loan constant (k%) will indicate whether the property’s leverage position is positive or negative. The result of this positive or negative leverage position will be reflected in the cash-on-cash rate of return ($/$%).
Positive leverage occurs when
- Free-and-Clear Rate of Return > k%.
The result is
- $/$% > Free-and-Clear Rate of Return.
In this case, the cash-on-cash rate of return is greater as a result of placing debt on the property. This circumstance would indicate that the cost of debt on this property is lower than the rate of return the property can produce free and clear of debt. From borrowing this relatively cheap money, the investor increases the actual rate of return on the property.
Negative leverage occurs when
- Free-and-Clear Rate of Return < k%.
The result is
- $/$% < Free-and-Clear Rate of Return.
In this case, the cash-on-cash rate of return is less as a result of placing debt on the property. This circumstance would indicate that the cost of debt on this property is higher than the rate of return the property can produce free and clear of debt. From borrowing this relatively expensive money, the investor decreases the actual rate of return on the property.
|
LEVERAGE EXAMPLE |
|---|
|
Suppose a property you manage has the following financial data.
What is the free-and-clear rate of return? $525,000 ÷ $6,000,000 = 8.75% What is the loan constant (k%)? $407,165 ÷ $4,985,000 = 8.17% What is the cash-on-cash rate of return ($/$%)? First, calculate BTCF: $525,000 - $407,165 = $117,835 Is this property in a positive or negative leverage position? 8.75% > 8.17% and 13.09% > 8.75%. |
The Four Tests
Back to TopNow that you have determined the current market value of the property and ownership equity and have conducted a loan analysis, the four tests of investment return can be calculated to determine the overall financial health of the property in its current state.
The four standard tests we will explore are
- Cash-on-Cash Rate of Return ($/$%);
- Value Enhancement;
- Net Present Value (NPV); and
- Internal Rate of Return (IRR).
Cash-on-Cash Rate of Return ($/$%)
Cash-on-cash rate of return ($/$%) measures an investor’s rate of return on the initial or current investment of equity. This ratio compares the cash invested in a property (equity) with the before-tax cash flow (BTCF) from one year.
Year 1 BTCF ÷ Current Equity = Cash-on-Cash Rate of Return ($/$%)
The cash-on-cash rate of return measures a 1-year return on invested dollars. It is a single-year snapshot of performance, and thus does not consider the effects of time on the investment. This test is most commonly used to show year-to-year trends in performance.
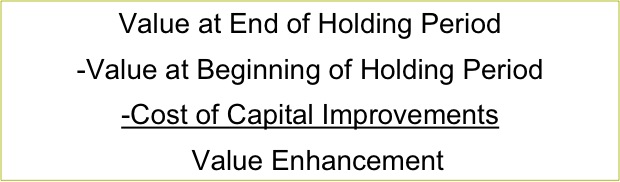
Value Enhancement
Value enhancement is the expected value at the end of the holding period less the initial value of the investment and the cost of implementing the improvements. It is a partial measurement of investment return over two periods of time—acquisition and disposition, or the end of the holding period. Though it measures what occurred over a holding period, it does not take into account the effect of time by discounting future value.
Net Present Value (NPV)
Net present value (NPV) is the difference between the cost of an investment and the discounted present value (PV) of all anticipated future fiscal benefits of that investment.
The PV of an investment is the maximum amount an investor should pay for the opportunity of making the investment and ultimately realizing a desired yield. It can be used to measure an asking price of a property with an investor’s offering price.
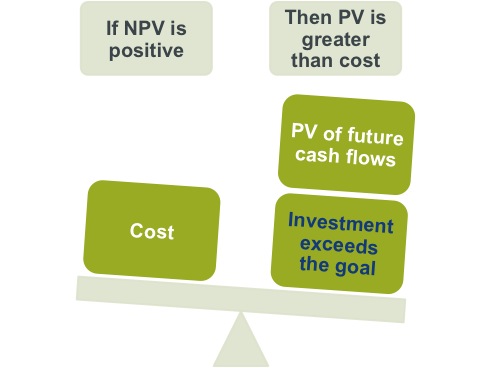
NPV is the same analysis, but this time the investment cost is subtracted from the PV of the cash flows. If the difference is greater than zero, a net gain will be realized from the investment and an investor will have exceeded the anticipated rate of return (discount rate). NPV can be used to compare alternative investments and rank them in order of desirability.
NPV is calculated by subtracting the present value of the equity investment from the present value of the expected cash flow returns. NPV is most useful when the required rate of return is known. In essence, NPV tells you how much more or less you can increase or decrease the initial equity investment to meet the desired yield.
A positive NPV means that the PV exceeds cost; in other words, the investment will earn more than the minimum acceptable return. A negative NPV means that the PV is less than cost, meaning the investment will earn less than the minimum acceptable return.
Net Present Value (NPV)

Internal Rate of Return (IRR)
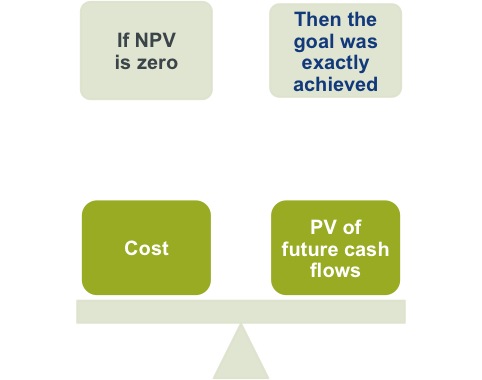
Back to TopWhat if an investor does not have a required rate of return in mind? In such a situation, using the IRR will be effective in evaluating an investment. IRR is defined as the rate of return that equates the present value of the expected future cash flows to the initial capital invested. The IRR is also the rate of return that results in an NPV of zero.
In the simplest of definitions, IRR is the rate of return that makes the money coming out of an investment equal to the money that went into the investment.
IRR is a calculation that can be applied to even or uneven cash flows. The same basic equation is used for both NPV and IRR, but in each case, a different question is being asked and answered. Like NPV, IRR calculations require a projected sale at the end of the holding period. Even if the owner has no plans to sell the property, this calculation must be included.
| FINAL PROJECT NOTE |
|---|
|
In narrative format, you will state and explain the results of each of the four financial tests for the property in its as-is condition using actual numbers. You will then relate the results of your as-is scenario to the ownership goals for the property. |